
What is value stream?
It goes by several names. The most common term is value stream, but you may also hear the usage of value chain as a synonym. As a first step, it might be useful to clarify what we mean by the different terms: A value stream is the set of activities that an organization performs in order to fulfil a customer request/order. If you think you don’t have to deal with this because you don’t have it (value stream), read the sentence again. Anyone having at least one customer also has a value stream. We can save a lot of money and energy if we know exactly what it is and keep improving it.
In this article, we’ll look at the basics, and I will seek to clarify the concept of value stream and some of the key benefits of mapping it. Advanced lean fighters should contact Balázs Tornai with any questions or suggestions and can even book an appointment on remoteguru.
Step-by-step value stream mapping
Now, that we have clarified what value stream is, let’s have a look at how we can gain insight into how it works. During value stream mapping, we visualize all activities, information flows and material flows that are required to fulfil the customer request. Material flow can also be understood in an abstract way, e.g. in a software development environment.
Let’s look at an everyday example that will help us better grasp the essence of value stream and the benefits of mapping it. In this case, we are talking about a value stream that shows the steps needed to ensure that a product from an online shop reaches the customer.
Figure 1: Let’s not forget the customer!
The first step is pretty straightforward: The focus should be placed on the customer: it is important to remember that the entire process is happening for them.

Figure 2: an outline of activities and systems supporting the flow of information
Once our customer is in place, let’s look at the different activities that need to be done to ensure that they are satisfied. It is also important to see where information flows. In our example, the steps of the value stream are as follows:
- When the goods are received, they are taken over from the manufacturer during inventory management, and an accurate inventory and quality control is carried out.
- The products are photographed.
- For retouching, we try to maximize the quality of the photo taken.
- An appropriate product description is written for the products.
- The product is uploaded to the online shop with a description and a photo.
- The ordered product is packed and dispatched to the customer.
- The package is delivered.
Currently, information flows through 2 systems:
- Inventory management is done in G suite, using Google Sheet, photos and product descriptions are stored in Google Drive.
- In the online shop, the customer encounters and orders the product and interacts with customer service.
If you have not thought about your processes before, it is a great help just to see the different steps and systems where the information flows. However, at this point, we do not have enough information to optimize operations. Let’s look at how we can improve this.
In the next step, we will have a detailed look at the links between the various processes and (!) the quality of the work delivered. At this point, we will collect more detailed information on the value stream, which is difficult to be done from behind a desk. Therefore, for this step, it is essential to “go out there”, see the different activities on the field and talk to the colleagues working in the processes. This form of field experience is called a Gemba walk. For those who want to master it, I recommend the book “Gemba Walks” by James Womack.
It is crucial that the Gemba walk also reveals the obstacles to the flow of work/product/service. A legitimate question that may arise is what exactly we call flow. In this case, perfect (!) flow means that the time needed to complete a particular process (process time or cycle time) is equal to the lead time: in our example, the time needed for retouching is 3 hours, which is equal to the time it takes for the retouching colleague to receive the job and to pass the photos on. In the case of our online shop, the retouching time is far from ideal: the cycle time is 3 hours, but the lead time is 10 days. It is advisable to identify obstacles preventing the flow on the field. At the moment we only have one person responsible for retouch tasks at the company, and this colleague has a lot of work to do all the time. In this particular case, it is the workload that prevents the flow based on the outlined information.
After assessing both the lead time and cycle time, we will look at the quality of work that is transferred from one process to another. To do this, let’s consider the percentage of photos that are transferred without error (no error-related feedback is received from any station in the value stream). For retouching, this rate is 90%. Once we have collected the data, let’s complete the value stream map with the information obtained for each process, and also indicate in our diagram how many tasks (one of the sources of loss type corresponding to storage loss in lean) are waiting for the respective processes.
Figure 3: During a Gemba walk, it is worth collecting this information on the various processes

Figure 4: Our value stream map with detailed data after the Gemba walk
Experience shows that at this stage we have a more accurate understanding of how they work, and have probably identified several points where we can make significant improvements if (!) we change the way things work. However, to get the full picture, we also need to see the flow of information and materials, as well as the overall performance of our value chain at the endpoint, which includes the ratios of cycle and lead times of all processes and steps, as well as a step-by-step and end-point summary of the quality of the work delivered. The result is often unpleasantly paralyzing at first glance. In such cases, it is particularly important to have the presence and involvement of an experienced facilitator who can help, among other things, not to overlook any pieces of information, and to find more efficiently the next steps that will be the most useful in terms of effort/energy investment.
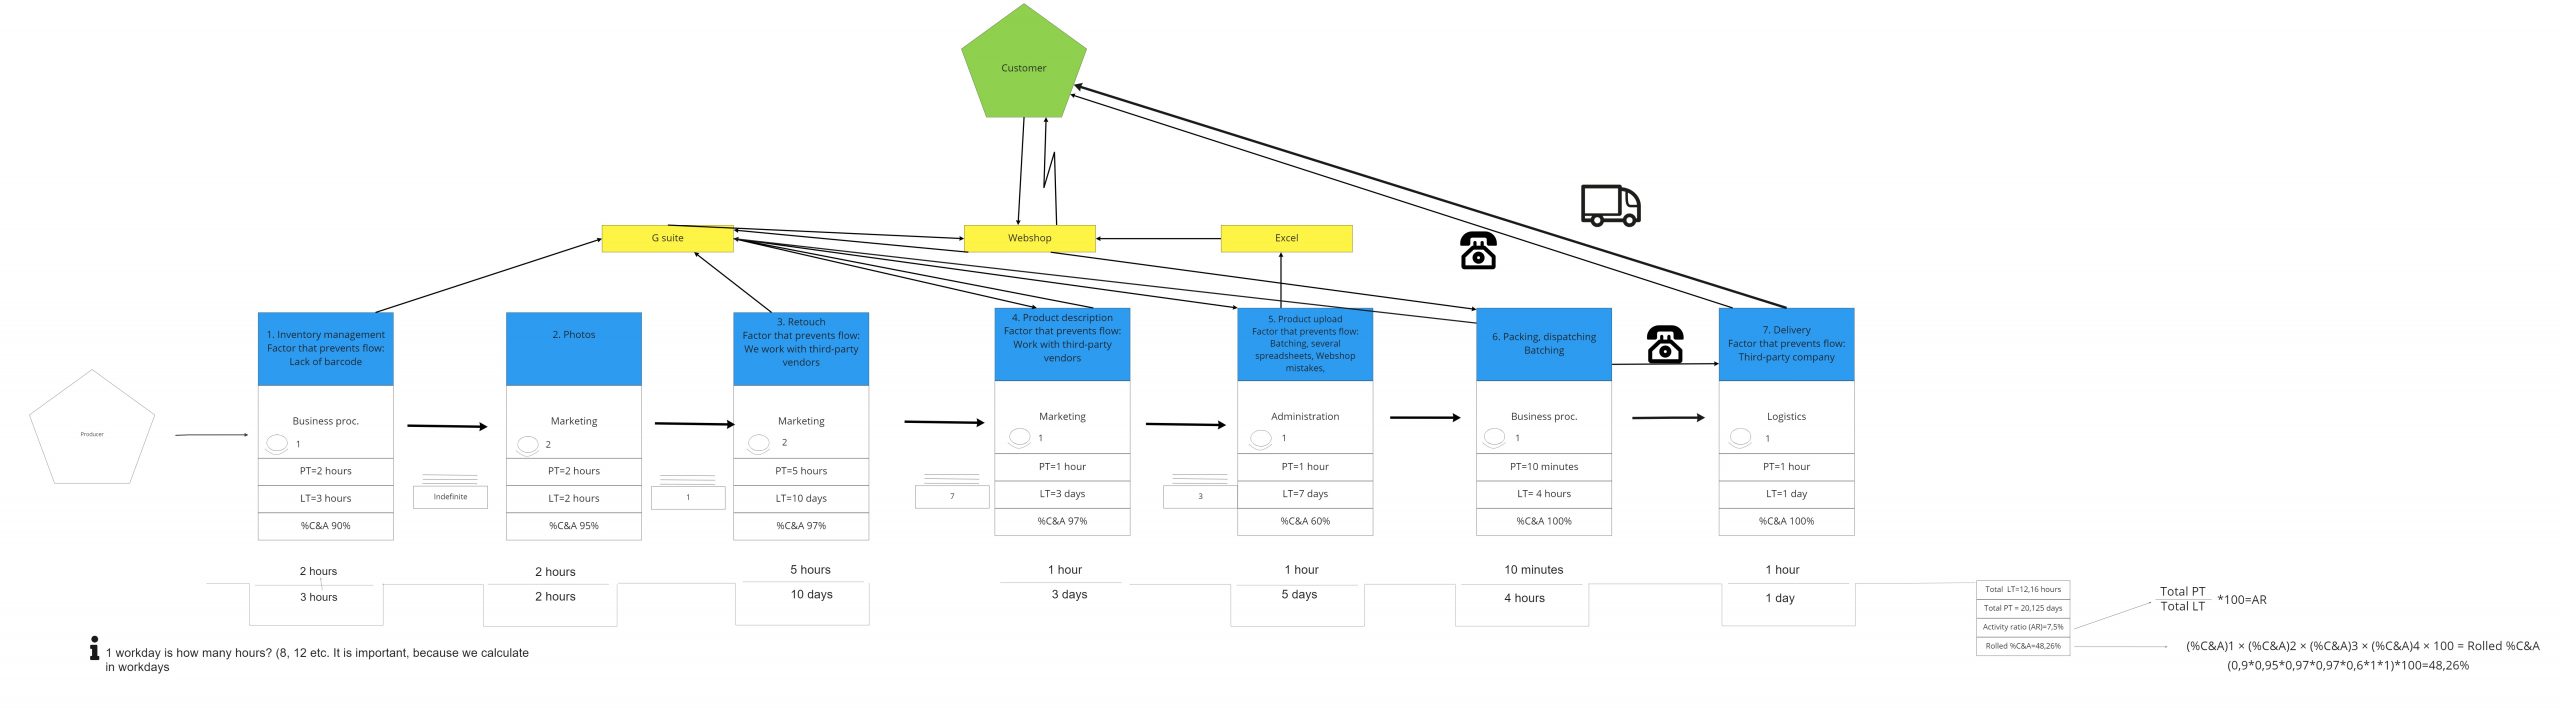
Figure 5: The complete value stream, showing the flow of information, the movement of materials and the real performance of our value stream.
I hope that, after reading this article, you are closer to understanding what value stream is and why it is important to have a clear understanding of it. If you have any unanswered questions in this regard, you can enroll in our training on value stream mapping.
